Energy research & public policy

Nikit Abhyankar

Understanding energy systems.
Informing public policy.

Dr. Nikit Abhyankar is a faculty member at the Goldman School of Public Policy, University of California, Berkeley, and Co-Faculty Director of the India Energy and Climate Center. He is also a Scientist in the Energy Markets and Planning Department at Lawrence Berkeley National Laboratory.

His research examines how countries can take advantage of dramatic declines in clean energy costs to meet their energy and development needs at the lowest cost, while building on existing infrastructure and institutions. His work spans the power sector, transportation, industry, and energy markets, with a particular emphasis on in-depth techno-economic analysis and policy design. It covers the United States and major economies including India, China, Indonesia, Japan, Korea, Mexico, and Vietnam.

He regularly advises national and state governments, regulators, and utilities in multiple countries on designing clean energy policies and programs.

He has published over 100 journal articles and research reports, and his research has been widely covered in the media. Nikit holds a Ph.D. in Environment and Resources from Stanford University.

Nikit Abhyankar
Nikit Abhyankar presenting at Pune International Centre, holding a microphone and gesturing beside the lectern
Pune International Centre India’s energy future · July 2026
Nikit Abhyankar speaking on a panel at the Raisina Dialogue
Raisina Dialogue Energy policy in discussion · March 2026
The India Energy Hour episode artwork with Nikit Abhyankar and hosts Shreya Jai and Sandeep Pai
The India Energy Hour Solar after Sundown · November 2026

Research directions

All research themes →

Selected publications

Complete bibliography →
  1. Communications Earth & Environment

    Journal article2026

    Aligning offshore wind deployment with local priorities to accelerate power system decarbonization

    Examines how offshore wind deployment can account for local priorities while supporting power-system decarbonization.

    Peng, Liqun, Gang He, Nikit Abhyankar, Haozhe Yang, Umed Paliwal, Jiang Lin

    Communications Earth & Environment, 7, 533 (2026).

  2. Cover of India’s Next Energy Efficiency Challenge: Cooling, Flexibility, and Electrification

    Research report2026

    India’s Next Energy Efficiency Challenge: Cooling, Flexibility, and Electrification

    Examines cooling, flexibility, and electrification as priorities for India’s next phase of energy efficiency.

    Abhyankar, Nikit and Amol Phadke

    Confederation of Indian Industry Green Business Council.

  3. Cover of India’s Renewable Energy Breakthrough: Coal-Like Reliability at a Lower, Fixed Price

    Research report2026

    India’s Renewable Energy Breakthrough: Coal-Like Reliability at a Lower, Fixed Price

    Compares firm renewable electricity with coal generation on reliability and fixed-price supply.

    Paliwal, Umed, Amol Phadke, Nikit Abhyankar

    India Energy and Climate Center, University of California, Berkeley.

Writing & conversations

Talks and recordings →

Lecture · Pune International Centre

India’s energy future

An overview of the opportunities and challenges shaping India’s energy future.

Podcast · The Reformist

Indonesia’s solar ambitions

A conversation about Indonesia’s solar ambitions and lessons from India’s energy transition.

Original animation · plays automatically, muted

Heat, rainfall, and India’s 2026 electricity demand

Watch this animation comparing daily temperatures, rainfall, and peak electricity demand across India in 2024, 2025, and 2026.
Read the original postClose original post
How India's Electricity Demand Surged in 2026? 

Less rainfall. Higher temperatures. Surging electricity demand. And all three happening together.

In my previous posts, I showed how the 2026 El Niño exposed serious risks to India's electricity supply:
Hydropower generation fell by ~20%, with 13 GW less hydro generation during peak demand hours (https://lnkd.in/p/gRtqfB7k).
Solar and wind, meanwhile, demonstrated remarkable resilience (https://lnkd.in/p/gmY3dz4x).

But what happened on the DEMAND side?
Watch this animation comparing daily temperatures, rainfall, and peak electricity demand across India in 2024, 2025, and 2026.

The summer heatwave in 2026 was extraordinary. But the REAL kicker was the monsoon (June - September).
May 21: Peak electricity demand reached a staggering 271 GW, nearly 50 GW higher than the same day in 2025.
July 18: Despite the arrival of the monsoon, peak demand was still 261 GW, compared with just 218 GW on the same day in both 2024 and 2025.
September 10: Demand surged again to 269 GW, almost matching the summer peak! This is over 40 GW higher than the July-September peak in 2025.

Why didn't the monsoon provide its usual relief?
India was hotter AND drier. Population-weighted average daily maximum temperature was 0.7°C higher than in 2025, while cumulative rainfall was 22% lower.

But the regional differences were enormous. Rainfall declined by 36% in western as well as southern India—far worse than the national average.

Within southern India, the contrasts were equally striking: Telangana received 46% less rainfall, Karnataka 40% less, and Kerala 18% less than in June–September 2025.

Hotter, drier weather pushes demand higher, and keeps it elevated well into the monsoon. At the same time, weaker rainfall constrains hydropower availability.
And the impacts are highly uneven across regions.

We have warned several times: India's air conditioning demand will be make-or-break for the grid. ~150 GW of additional room AC demand is expected in the coming decade.

What does this mean for summer and monsoon 2027?
India will be entering the peak demand season with substantially lower reservoir capacity and significantly higher demand due to El Nino.

What other patterns and risks do you see? 
The animation also shows some really cool insights on how heatwaves and storms traverse across the country.

Comment if you are interested in seeing this data.

Amol Phadke Jose L. Dominguez B. Nihar Shah Soonee Sushil Kumar Narasimhan S.R. Ashwin Gambhir Ministry of New and Renewable Energy (MNRE) Ministry of Power Govt of India Grid Controller of India Limited Central Electricity Authority (Cea) GHANSHYAM PRASAD Alok Kumar Priyanka Paliwal Alexander Hogeveen Rutter India Energy & Climate Center (IECC) Paritosh Jaiswal Dipesh Pherwani Piyush Narang Shruti Mahajan Deorah Neelima Jain Mohit Bhargava
View post & discussion on LinkedIn ↗
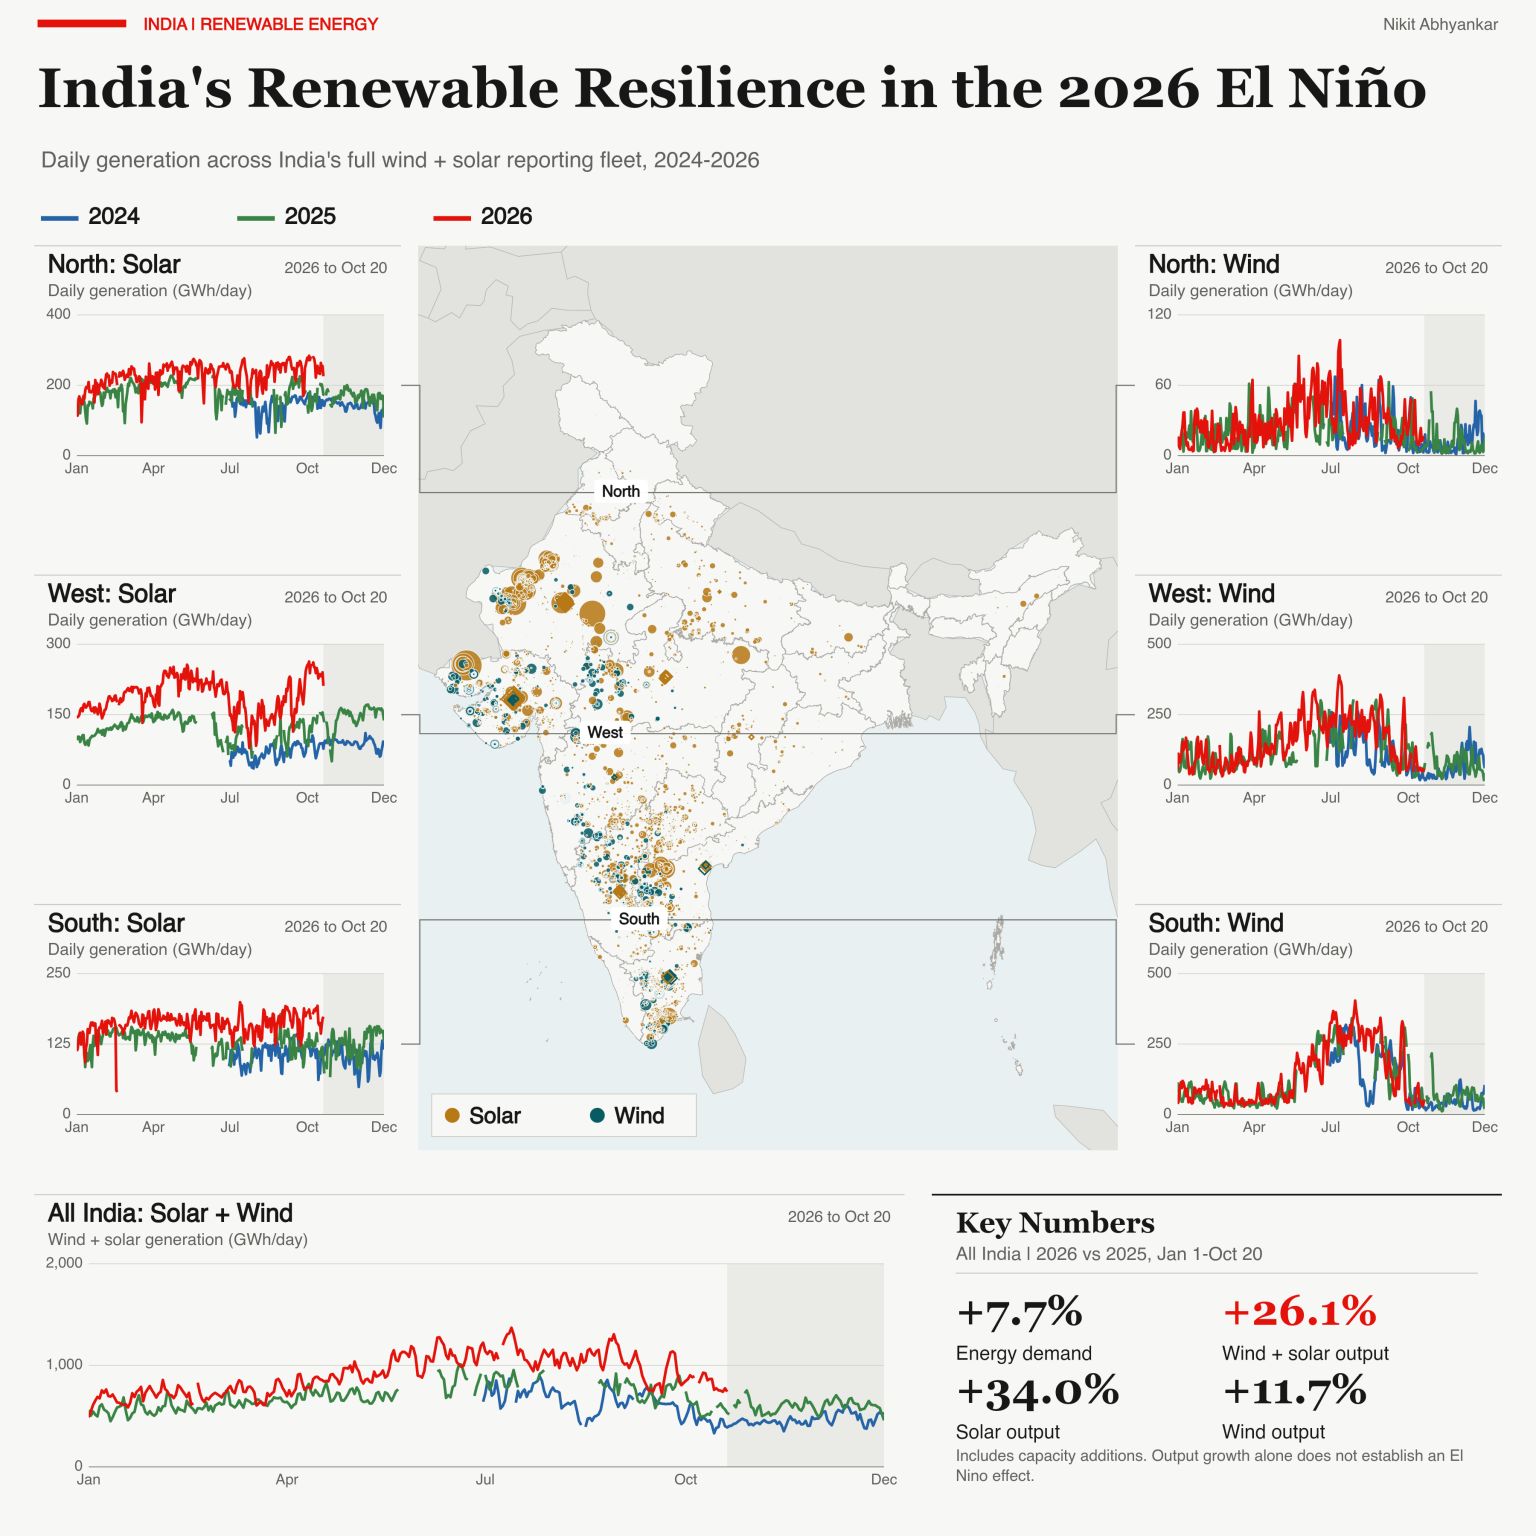
Daily solar and wind generation across India’s northern, western, and southern regions, comparing 2024–2026, with a power-plant map and January–October growth figures.
Original chart · open image to enlarge

India’s renewable energy resilience during El Niño

India's Renewable Energy Resilience in the 2026 El Niño ☀️⚡ Solar and wind generation grew more than THREE TIMES as fast as electricity demand!
Read the original postClose original post
India's Renewable Energy Resilience in the 2026 El Niño ☀️⚡

Solar and wind generation grew more than THREE TIMES as fast as electricity demand!

But that's not the most interesting part. Look at the shape of the generation curves—not just the growth in generation. The chart shows daily electricity generation from every solar and wind power plant in India 2024-2026.

In my previous post, I showed how the 2026 El Niño year has exposed a major vulnerability in India's electricity system. See here: https://lnkd.in/p/g58JuHqd
⚡ Peak electricity demand reached 270 GW—40 GW higher than last year.
💧 Hydropower generation fell by ~20%, with 13 GW less hydropower available during peak demand hours.
This caused severe pressure on the grid, resulting in electricity shortages.

But here's the other side of the story.
Comparing 2026 with 2025 (January 1–October 20):
⚡ Electricity demand: +7.7%
☀️ Solar generation: +34.0%
💨 Wind generation: +11.7%
🌱 Combined solar + wind generation: +26.1%

India's massive renewable energy capacity additions have helped meet rapidly growing electricity demand, even as hydropower availability deteriorated sharply.

But look closely at the regional charts.
1. Wind generation continues to follow its familiar seasonal pattern. Despite the hydropower shock, there is no corresponding collapse in aggregate wind generation.
2. Solar generation has grown dramatically, while broadly retaining its seasonal patterns. Of course, much of the generation growth reflects new capacity additions.

Note the charts do not establish that capacity factors were unchanged or that El Niño had no impact on solar and wind resources. Hydropower, solar and wind face their own weather-related risks, but these risks need not move together.

And that's why this is an important resilience story. India's expanding and geographically diverse renewable energy portfolio has helped cushion the electricity system against a major hydrological shock.

Solar and wind cannot directly replace all the flexibility hydropower provides, especially during evening peaks. Energy storage, smarter grid access, stronger transmission networks, and flexible demand are essential.

Renewable energy resource + geographical diversification is an important climate resilience strategy.

Explore our interactive daily power-plant-level generation dashboard: https://lnkd.in/gj_Xt6SD

#RenewableEnergy #IndiaEnergy #GridResilience #EnergyTransition #ElNino #BRES2027

Ministry of New and Renewable Energy (MNRE) Bharat Renewable Expo | BRE2027 International Solar Alliance Ministry of Power Govt of India India Energy & Climate Center (IECC)
View post & discussion on LinkedIn ↗
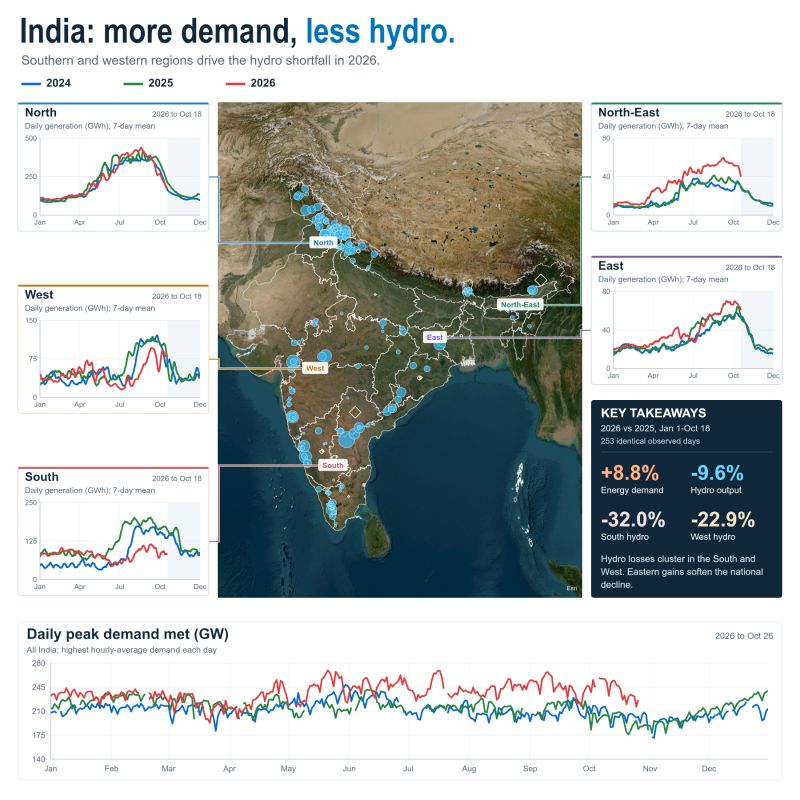
Regional hydropower generation and national peak electricity demand in India, comparing 2024, 2025, and 2026.
Original chart · open image to enlarge

El Niño and India’s grid vulnerability

El Niño is exposing a critical vulnerability in the Indian power grid. 40 GW higher peak demand. 13 GW less hydropower during peak.

Read the original postClose original post
El Niño is exposing a critical vulnerability in the Indian power grid.
40 GW higher peak demand. 13 GW less hydropower during peak.

The chart shows daily hydro electricity generation across every hydro plant in India, 2024–2026, alongside national peak demand. Red = 2026, Green = 2025, Blue = 2024.

During July–September 2026, India's peak electricity demand reached 270 GW, which is ~40 GW higher than a year earlier. At the same time, hydropower generation during peak demand hours fell by 13 GW. Total hydro energy generation has fallen by ~20%, relative to 2025.

The result? Severe pressure on the grid and widespread power shortages.

But the El Nino hydropower impact is very different regionally.
Southern India: Hydro generation fell sharply during the monsoon months.
Western India: Generation has been significantly weaker during several critical periods.
North-East and East: Surprisingly, hydropower generation has actually been higher than in previous years during much of 2026.
Northern India: Generation has been relatively resilient.

This is why national averages can be so misleading.
El Niño exposes a potentially dangerous double vulnerability: hotter weather drives electricity demand higher, while weaker rainfall and reservoir inflows constrain hydro - one of the grid's most valuable sources of flexible generation.

==> We need to fundamentally rethink how we assess weather-related risks in electricity planning.

Explore daily electricity generation and costs for power plants across India:
https://lnkd.in/gj_Xt6SD
Amol Phadke Mohit Bhargava Umed Paliwal Paritosh Jaiswal India Energy & Climate Center (IECC) Ministry of New and Renewable Energy (MNRE) Soonee Sushil Kumar Narasimhan S.R. Ashwin Gambhir Ministry of Power Govt of India Neelima Jain Shruti Mahajan Deorah
#waterstress #india #grid #hydropower #elnino
View post & discussion on LinkedIn ↗

See all posts on LinkedIn ↗

Get in touch

nikit@berkeley.edu

Academic correspondence, policy discussions, and media inquiries.

Contact & institutional profiles →